
Initial Analysis
Despite the invention of radar; the sightings of U-boats from aircraft depended mainly on the visual scanning of the area by crew members. The main issue O.R.S. faced was a double sided one: the aircraft needed to be able to see the U-boat, but not be seen until it was close enough so that it was impossible for the U-boat to submerge before being attacked. The solution to the one side of this problem involved bettering the aircraft's sightings, crew members etc. The other involved defeating the enemy look-out by using camouflage, for example.
The problem was first considered in September 1941, and so the data used to analyse was that available until May 1941. It was found that in 40% of cases, U-boats had already started diving when spotted by the aircraft. Furthermore, in 20% of cases the U-boat had already submerged (so that only the periscope was visible) by the time it was spotted. Hence, 60% of U-boats saw the aircraft before the aircraft spotted the U-boat. However, this figure does not take into account any U-boats that may have already seen the aircraft and completely submerged before being sighted.
Studies showed aircraft were only sighting a small percentage of all U-boats (approximately 30%) because the aircraft were being spotted first, with plenty of time for the U-boats to submerge. Of course we know that of this 30% being spotted, 60% had spotted the aircraft first.
A histogram was plotted of the times U-boats started submerging after they had been spotted by aircraft, in other words the length of time it took for a U-boat to spot the aircraft after the aircraft had spotted the U-boat. The frequencies at negative times are estimates of the times elapsed when a U-boat started submerging before being spotted by an aircraft.
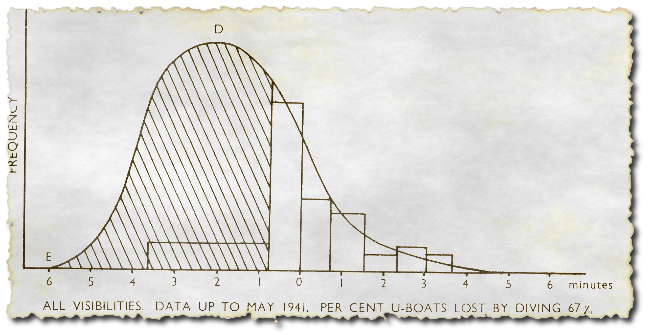
Such a distribution would be expected to be part of a normal distribution. Since we are only interested in the U-boats which aircraft may have seen, the fitted curve must decrease to zero at E on the left hand as this time corresponds to the maximum distance from which an aircraft can see a U-boat. Similarly for the right hand side. Now the area under the curve represents the number of u-boats which could possibly have been seen. By calculating this and comparing with the confirmed number of sightings, ORS concluded that aircraft were missing around 67% of U-boats they could have possibly seen.
Further analyses showed that almost 30% of U-boats which were visible when attacked were found in conditions of low visibility (less than 2 miles). This figure was much higher than expected, and showed the U-boats depended mainly on visual detection.
It was also found however that some U-boats (approximately 25%) failed to dive before being attacked even in times of good visibility - demonstrating that the U-boats' sightings were by no means perfect!
It was concluded that although improving aircrafts' sightings was an issue needing to be addressed, concentrating on making the aircraft less visible was also important. For example, it must be noted that whilst these studies were taking place the aircraft in use were the standard black bombers.